| » Home matches | Away matches | overall |
| # | Team | sum | Matches | average | |
|---|---|---|---|---|---|
| 1 |
|
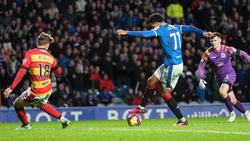
Rangers FC | 43.454 | 1 | 43.454 |
| 2 |
|
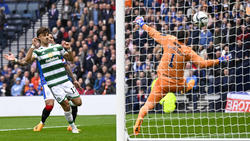
Celtic FC | 73.412 | 2 | 36.706 |
| 3 |
|
Hibernian FC | 14.297 | 1 | 14.297 |
| 4 |
|
Aberdeen FC | 22.349 | 2 | 11.175 |
| 5 |
|
Greenock Morton FC | 13.956 | 3 | 4.652 |
| 6 |
|
Kilmarnock FC | 4.407 | 1 | 4.407 |
| 7 |
|
Motherwell FC | 4.119 | 1 | 4.119 |
| 8 |
|
Forfar Athletic | 4.012 | 1 | 4.012 |
| 9 |
|
St. Mirren FC | 7.825 | 2 | 3.913 |
| 10 |
|
Partick Thistle | 3.843 | 1 | 3.843 |
| 11 |
|
The Spartans FC | 3.500 | 1 | 3.500 |
| 12 |
|
Inverness CT | 4.820 | 2 | 2.410 |
| 13 |
|
Ayr United | 1.623 | 1 | 1.623 |
| 14 |
|
Dumbarton FC | 2.405 | 2 | 1.203 |
| 15 |
|
Dunbar United | 749 | 1 | 749 |
| 16 |
|
Forres Mechanics FC | 541 | 1 | 541 |
| 17 |
|
Kilwinning Rangers | 527 | 1 | 527 |
| 18 |
|
Albion Rovers | 511 | 1 | 511 |
| 19 |
|
Tranent Juniors | 485 | 1 | 485 |
| 20 |
|
Huntly FC | 435 | 1 | 435 |
| overall | 207.270 | 27 | 7.677 | ||